Novel Coronavirus - Predicting New Cases by Prefecture (Practice)
The project described below is an exercise in getting comfortable with manipulating data from various sources, generating interesting features and using them in a predictor.
Full code can be found here.
Background (skip if you just want to see implementation)
At the time of taking on this project (around mid-April 2020), the state of COVID-19 in Japan was shrouded in mystery.
The Japanese government dealt with the virus in their own unique way, instantiating a task force to implement a “counter-cluster” strategy. This meant testing some people with heavy symptoms, testing anyone who came into contact with that person if the test came back positive, and requesting the temporary closure of any businesses/facilities associated with that person.
I tweeted a translation of the official strategy here.
Outsiders looking into Japan observed a lack of testing for new cases and pointed out that official data would understate the spread. Government officials argued that the PCR tests available at the time were unreliable and false positives in testing would only serve to stretch already limited resources and over-burden medical institutions.
(At the time of writing this blog post at the end of May 2020 cases did increase exponentially for a short time, leading to the declaration of a state of emergency in many prefectures. This seemed to limit the spread, but there is still a lot of discussion about the best route back to normality.)
I’m not an epidemiologist so the scope of my contribution to the pandemic with data analysis is pretty much zero. Putting out inaccurate, poorly thought-out information and analysis can be dangerous at the best of times, and without specialist knowledge I felt like my chance of accidentally doing so was high (even if its likely no-one will pay attention!).
Nevertheless, it seemed like a good opportunity to use some of the data being made available to get some Python practice and at the same time gain a better personal understanding of the state of COVID-19.
Task
Build a predictor in Python using the sklearn library to estimate the number of new COVID-19 cases on a given day by prefecture in Japan.
The model should use a combination of historical case counts and other features
“engineered” from the data.
Tools used
- Numpy, Pandas, Matplotlib, sklearn
- Case count by prefecture data powering this Japan COVID-19 Coronavirus Tracker
- Testing data released by MHLW, recorded by Toyo Keizai in this Github repo.
Implementation
Manipulating case data from the Tracker
The data was provided in JSON format which, when shown in a data frame, contained each case in a single row. Each row had information on gender, age range, prefecture and patient status.
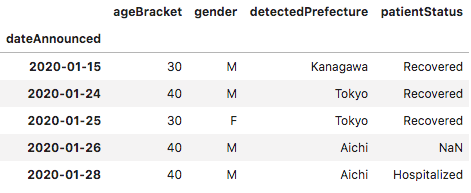
I wanted to extract the following for cases in each prefecture:
- How many new cases were there in a given prefecture by day?
- What was the gender ratio of these cases?
- What was the average age of these cases?
Some pandas manipulation later, we ended up with something like this:
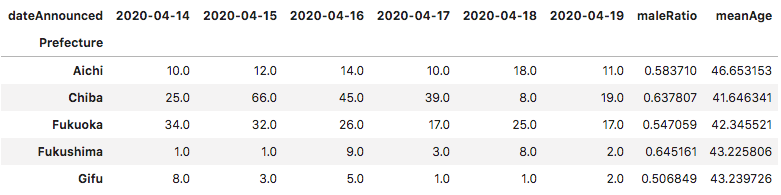
Prefectures that did not record case data for at least 3 of the 5 days being used for prediction were cut out, leaving a total 32 of 48.
Manipulating testing data from the MHLW (provided by Toyo Keizai)
Since the number of new cases found is a function of tests implemented, including the daily number of tests was important.
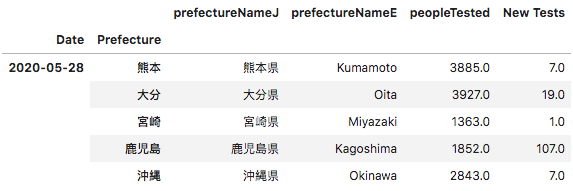
In the “peopleTested” column, the MHLW provided a cumulative total number of tests to date by prefecture (albeit this did not include a lot of tests provided by hospitals).
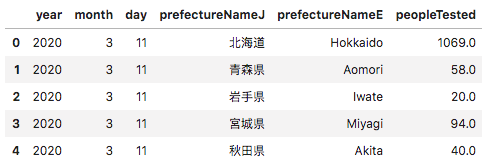
Getting the daily total would involve subtracting the total of the previous day and keeping in a separate column “New Tests”.
Running a Linear Regression
After combining data from the data sources described into a single data frame, I ran a linear regression to predict the total number of cases on a given day in each prefecture given the following independent variables:
- Number of cases in each prefecture for the 5 days prior
- Number of tests given in each prefecture for the 5 days prior AND the day being predicted
- The historical gender ratio of cases in each prefecture (until the day being predicted)
- The historical mean age of cases in each prefecture (until the day being predicted)
In the image below, the “2020-04-19 Cases” column is the dependent variable.

I used a 70 to 30 train/test split, training on 22 prefectures and predicting for 10.
Results
Here’s how the predictions stacked up against reality.
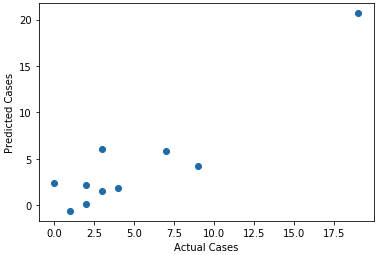
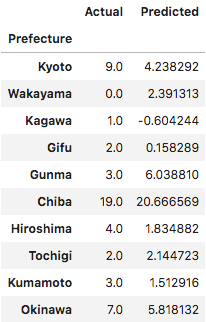
There’s definitely some predictive value in the regression. Now let’s take a look at the coefficients associated with each independent variable.
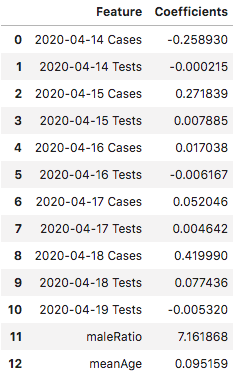
It’s no surprise to see a general trend that days closer to the day being predicted have more predictive power. I was surprised to see that the number of tests given on the day being predicted had no real predictive value at all. Since the number of cases should a direct function of the number of tests given, it would be worth digging deeper into the reporting mechanism and how that relates to the number of cases found.
The coefficient for maleRatio also seemed pretty high. Taking a quick look at the maleRatio across all prefectures, the ratio seemed to be higher in more densely populated areas that would inherently have more cases. This could be due to a higher proportion of men vs women having to commute or a bias towards men getting tested for COVID-19 over women in general, and may merit further analysis.
Final Words
As a predictive tool, the linear regression I performed above had some (albeit limited) predictive value.
The lack of predictive value of the number of tests given and the sizable coefficient for the maleRatio variable are examples of how performing this kind of analysis can provide clues for routes to investigate further.
Our goal as data scientists isn’t to make perfect predictions and completely eliminate uncertainty, but to reduce it as much as we can to facilitate better decision-making.